Step 1: Business Intelligence (BI)
There is no doubt that the guesswork days are over. Most executives who work in supply and demand chain management these days are well aware of the importance of business intelligence (BI) systems to optimize their company. Yet, after investing and integrating into a particular system, many businesses may feel that the solutions do not live up to their promises. To address that, this article will shed some light onto the sources of this problem.
Let’s take a look at a hypothetical situation. If you have 200 stores with 25,000 SKUs supplied by some 1,000 vendors, optimizing your supply chain means analyzing five billion possible combinations of just these three factors alone. For many organizations, the SKU/store count is much higher.
BI systems may do a great job monitoring your inventory levels in real time; generating sales and trends reports; cost benefit analysis; demand changes due to promotions; and seasonal profiles. But what do you do with this wealth of information? And how do you put it to action?
Suppose that inventory level analysis indicates that you are overstocked on certain slow-selling items. You can react by lowering prices, running promotions or altering assortment. However, whatever you do, you’re still reacting to the problem that already occurred—and money that is lost.
Depending exclusively on backwards-looking BI solutions is the same as driving a car with a GPS that constantly shows you where you were 10 minutes ago; or watching a newsman that reveals yesterday’s weather report.
Step 2: Statistical Forecasting
Traditional forecasting processes look for statistical properties—including changes—that are constant such as levels; trends; seasonal patterns; interventions; leads; and lags and assumes that those properties will continue to look the same in the future as they did in the past.
In other words, if year over year a retailer sells three times more merchandise in December than in November (seasonality), one would assume that the next year this ratio will remain the same. While this approach may work well for certain type of merchandise—such that is repetitive or replenishable—under certain assumptions (there are no year-over-year changes), the reality is that today’s retail businesses are all about change.
If we could characterize today’s retail environment in one word, it would certainly be the word “dynamic.” Products in new styles or colors are introduced every season—many of which have very short-life cycles and replacement SKUs that don’t necessary behave the same way as their predecessors. New assortment changes the cannibalization effect and affinity relations shift. Moreover, consumer demand will change depending on the price strategy you decide to use. Products aren’t necessarily sold at the exact same prices as in the previous years. At the same time, some products are more elastic to price changes than others, while promotional activities constantly change as well. For instance, social media used in combination with traditional methods of customer reach creates new marketing channels and new market segments. You must account for constantly changing competition—especially Web competition—with their aggressive price strategies, assortments and promotional events.
When you look at how these dynamic factors can affect consumer demand, it quickly becomes evident why standard forecasting and traditional statistical techniques do not live up to expectations. In such a dynamic environment, statistics is not the best tool for planning and demand forecasting. Instead, a system that is dynamic and proactive is key.
Step 3: Predictive Analytics
So far, we’ve only featured a few major influencing factors that affect demand forecasts. Yet, in reality there are many more contributing factors that need to be considered.
The major difficulty lies in understanding the interrelations between these factors.
If in a certain week 100 units of a particular product were sold in a specific location, how do you know how many of these 100 sales can be attributed to the natural demand? What was the effect of price? Was it a regular price or a markdown? Maybe if these 100 units were sold at a discounted price, the actual demand was only 70 units?
Additionally, did the store have enough inventory to satisfy the demand for this product? If there was more inventory, could the store have sold more, e.g., 120 units instead of the original 100? Was this product or any related product promoted and how did the promotion affect sales?
We tend to observe the final number –a sale of 100 units. Yet, actual demand is very different in many cases. The ultimate goal is to find actual consumer demand. This is what we need for forecasting and planning purposes.
But calculating the effect of any of these factors is a challenging problem. Most businesses are familiar with:
- Forecasting systems that calculate the effect of seasonality;
- price optimization systems that calculate the price elasticity of demand;
- Systems that calculate the effect of weather-related changes in buying habits; or
- Promotional management systems.
In every case, it takes a sophisticated system to calculate the effect of one component of a consumer demand.
However, have you ever thought about whether these individual systems take each other’s results into account? Should they?
If your system manages prices without considering inventory management, logistics or events it does not optimize your prices. Similarly, if your system calculates demand forecasts without considering returns, promotions and other related factors, then it’s not much of a forecast, is it?
To calculate the combined effect of all influencing factors, requires a new approach called business-specific predictive analytics.
Understand the use of business-specific predictive analytics
Tailored specifically for the supply chain environment, business-specific predictive analytics can cover a wide variety of unplanned situations that may influence future consumer demand. As the result, it produces accurate forecasts with little involvement on the part of business analysts. With business-specific predictive analytics, the accuracy of future demand forecasts grow dramatically. No wonder predictive analytics technology picked up so much attention so fast.
Gartner's “2012 Emerging Technologies Hype Cycle” chart shows predictive analytics as the most proven emerging technology in 2012. According to Gartner, predictive analytics passed through the inflated hype stage, disillusionment and period of enlightenment—to the point where it is ready to be accepted by mainstream users. Similarly, a quick look at Google Trends reveals that there has been an over 300 percent spike in searches for predictive analytics since 2010.
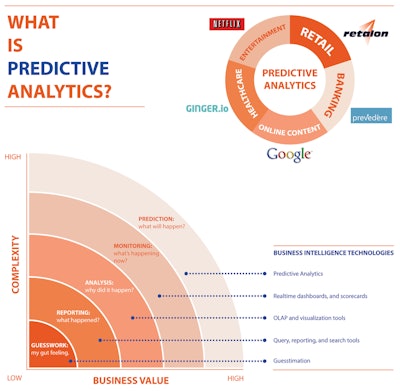
Predictive analytics proves to be increasingly useful across multiple industries including e-commerce; marketing and social media; banking; healthcare; and entertainment (see illustration). Some of the ways that predictive analytics is used include cases in which:
- Social marketing companies predict shopping habits and try to figure out the consumer’s next move
- CFO’s use predictive analytics today to minimize risks and keep business agile in economically uncertain times
- Online content providers and advertisers utilize predictive analytics to push relevant content to their users increasing conversion rate to record heights.
- The medical and healthcare industry run the data they’ve collected through predictive analytics engines to foresee healthcare epidemics. Additionally, pharmaceutical companies start to gain greater visibility on when patients will most likely develop additional side effects
- Synoptic meteorologists collaborate with research centers and universities to build predictive analytics models to identify upcoming hurricanes, earthquakes and other natural disasters
Supply chain improvements in forecast accuracy
Any well-rounded supply chain executive will tell you that nothing ever stays the same. Things are constantly changing, forcing businesses to reinvent their approaches to supply and demand chain management. You must take all available information into account to have a tangible action plan ahead of time, so that you can make smarter decisions going forwards.
There will always be some organizations that will wait a bit longer and see how the predictive analytics venture plays out. Sure, there are late adapters that prefer to wait for new technology to become industry standard. Just be aware, that while you wait, industry research conducted on almost 90 retail organizations across multiple industries shows stable improvement in forecast accuracy by average of 23 percent; 28 percent in inventory cost reduction; an increase in sales by 12 percent; and overall increase in GMROII of over eight percent. And these fashion, apparel, hardware, home and grocery companies (to say the least) may just be the ones you are competing with. The future of predictive analytics is here now—do you really want to play the adoption waiting game?
Yan Krupnik, a graduate of Ryerson University, Toronto, is the Marketing Manager for Retalon, provider of advanced predictive analytics solutions for retail since 2002.


