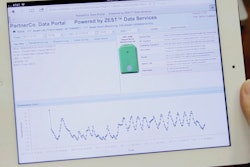
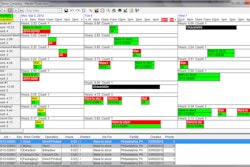
Oakland, Calif.—April 3, 2012—International Asset Systems (IAS), a provider of cloud-based solutions for intermodal transportation and global cargo container shipping, announced its Business Intelligence (BI) modules, which allow customers to better view and analyze data generated in their daily equipment repair and dispatch operations. The ability to manage by exception and analyze critical business information allows decision makers to quickly decipher data to make better, informed decisions.
“Ocean carriers, shippers, 3 & 4-PLs, equipment lessors and freight forwarders need to be able to quickly and easily perform in-depth analysis of performance, cost and revenue related data so they can turn this insight into actions that grow profits and improve customer service levels,” said Paul J. Crinks, Chief Executive Officer, IAS. “With these new BI tools, our customers will be able to establish and monitor KPIs enabling decision makers to more effectively respond to performance issues or questions by accessing and interacting with meaningful visualizations of their data.”
DispatchInsight and EquipmentInsight BI applications are delivered via the Web as modules in the IAS Dispatch and IAS Equipment solution suites. Because the new modules are extensions of the cloud-based solutions, they are deployed without the need of an IT department. Users gain quick visibility into a myriad of operational data generated in their intermodal networks, eliminating guesswork and facilitating decision-making.
DispatchInsight and EquipmentInsight provide the ability to:
- Analyze trends to decrease intermodal transportation spend while improving vendor performance
- Analyze trends to reduce repair cycle turn times and increase equipment utilization
- Accelerate fact-based decision making
- Improve vendor performance by benchmarking costs and turn times
- Create visual models, such as dynamic charts and graphs, business analytics, and what-if analysis
- Build list-based, tabular, or chart reports via drag and drop functions


