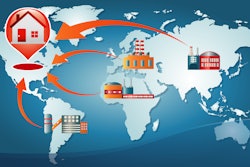
Inland barge transportation is a cornerstone of the U.S. energy supply chain, facilitating the movement of crude oil, refined products, and renewable fuels across the nation’s waterways. However, the logistics involved are fraught with complexities that can impede efficiency, responsiveness, transparency, and customer satisfaction. The sheer scale of operations, fluctuating demand, regulatory requirements, and unpredictable weather events all contribute to the intricate nature of barge logistics.
Delays or miscommunications can have cascading effects, impacting inventory management and delivery schedules throughout the supply chain.
By embracing technological strategies such as data analytics, AI, automation, and machine learnings, organizations can unlock new levels of visibility, agility, and reliability in their supply chain operations.
The role of inland barges in U.S. fuel logistics
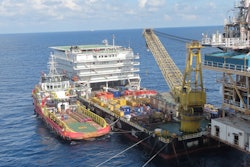
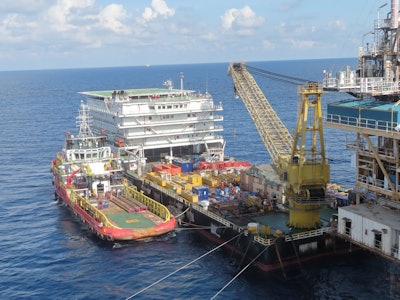
The U.S. inland barge industry plays a critical role in the transportation of crude oil, refined products, and other transportation fuels. This mode of freight movement is not only economically vital but also among the most fuel-efficient and environmentally sustainable options available for bulk liquid logistics. Petroleum is the single largest commodity transported on U.S. inland waterways, accounting for approximately 244 million tons annually. This makes it a core pillar of domestic logistics, particularly in regions served by the Mississippi River system and its extensive tributaries.
From an efficiency standpoint, inland barges offer substantial advantages over rail and truck. A single barge can carry between 10,000-30,000 barrels of oil, and a tow of multiple barges can transport as much as 90,000 barrels in a single movement, exceeding the capacity of most unit trains. This capacity, combined with superior fuel economy, positions barges as a cost-effective solution for large-scale fuel distribution. On average, a barge can move one ton of cargo 675 miles per gallon of fuel, significantly outpacing both rail and trucking in fuel efficiency and associated emissions.
The economic impact of this system is substantial. The inland waterways network moves roughly 630 million tons of cargo annually, valued at over $73 billion. States such as Texas and Louisiana each contribute more than $10 billion in annual barge-shipped goods, much of which includes petroleum and related products. This vast logistical capability is supported by more than 12,000 miles of navigable waterways, encompassing the Mississippi River, Ohio River, and Gulf Intracoastal Waterway, among others. These inland corridors enable seamless connections between refineries, terminals, and end markets across the country.
The complexity of barge logistics
Operating barge logistics in the U.S. energy sector requires navigating a web of operational, environmental, and informational variables that are often in flux. For refiners, fuel distributors, and terminal operators, this complexity goes well beyond simply scheduling vessels. Real-time visibility into vessel location is critical, yet not always reliable. Many operators rely on automatic identification system (AIS) data, but that information can be inconsistent or delayed, particularly in less trafficked segments of the inland river system. Moreover, it really only provides insight into the location of the pushboat or towboat, not the tow or individual barge level of granularity.
Beyond positioning, river conditions themselves add another layer of uncertainty. Water levels can change quickly due to weather, upstream releases, or seasonal variations, affecting both navigability and barge draft limits. These fluctuations must be continuously monitored and factored into routing and scheduling decisions. Weather adds further unpredictability; fog, high winds, and storms can slow or halt traffic altogether. Seasonal ice conditions, particularly in northern river segments like the Upper Mississippi and Ohio Rivers, can limit navigation windows to 8–9 months per year, while temporary issues such as silting and active dredging zones can impose unexpected draft restrictions, one-way traffic, or slowdowns that disrupt schedules with little notice.
Then there’s the infrastructure challenge. The U.S. inland waterway network includes on the order of 200 lock sites, many of which are over 50 years old. These structures are essential for moving barges through elevation changes in the river system but are often constrained by maintenance needs and congestion. Queues at major locks can delay shipments by hours or even days, cascading through delivery schedules and inventory planning. In addition to locks and dams, transit times on the inland waterways can be affected by ice control structures, flood control facilities, and movable bridges such as swing or lift spans, all of which may require coordination or impose navigation restrictions depending on seasonal or operational conditions.
Compounding all of this is the nature of the data itself. Much of the information that logistics teams need, such as lock status updates, Coast Guard bulletins, maintenance alerts, and even internal communications, exists in unstructured formats. Barge traffic emails, PDFs, Excel attachments, radio transcripts, and even handwritten logs are still common. Integrating and interpreting this unstructured data in a timely way is difficult, and without streamlined access to the right information, operations suffer from blind spots that reduce efficiency and responsiveness.
The opportunity for improvement
Together, the challenges outlined above underscore the need for process and technology solutions that can bring structure, clarity, and agility to barge logistics in the oil and fuel supply chain. Without that foundation, even experienced teams are forced to operate reactively rather than strategically. Given the operational complexity and data fragmentation that characterize inland barge logistics, technology presents a clear path to improvement. The challenge lies not in the absence of data, but in the difficulty of aggregating, interpreting, and acting on it in time to make meaningful decisions. Emerging tools, such as blockchain for a secure distributed ledger and machine learning for predictive traffic management, can all contribute to a more innovative and responsive supply chain management strategy. That’s where targeted digital investments can deliver significant returns.
One of the most effective strategies is implementing integrated data platforms that consolidate inputs from multiple systems (e.g., vessel tracking, weather feeds, lock queue reporting, inventory management, and more) into a unified operational view. Utilizing technologies such as optical character recognition (OCR), robotic process automation (RPA), and artificial intelligence (AI) can reduce or completely eliminate the manual effort associated with ingesting the wide range of structured and unstructured data about inland river asset traffic, structures, facilities, river conditions, and more. Rather than relying on siloed spreadsheets and fragmented communication, logistics teams can access a single source of truth that spans the entire journey from loading to delivery. For example, most oil and gas industry scheduling and logistics tools are focused on the barrel or the gallon, but what is really needed in this context is an asset-centric (i.e., barge) and route-centric view that informs the volumetric position. This foundational visibility reduces delays, supports better coordination with carriers and terminals, and enables more proactive decision-making.
Accurate vessel tracking, whether through AIS on the towboat or GPS units on the barges themselves, is essential for maintaining visibility of both the horsepower unit and the barrels, particularly when managing mid-route drop-offs, pick-ups, or power unit switches that introduce complexity into inventory and location tracking. AI and machine learning (ML) tools can take this a step further. By analyzing historical and real-time data, these systems can surface patterns that humans may miss, such as recurring choke points due to river congestion or correlations between water level trends and barge draft performance. This predictive capability can improve planning with more accurate transit times and ETAs, allowing schedulers to preemptively reroute or reschedule shipments before disruptions occur. When paired with geospatial analytics, these kinds of solutions can help pinpoint inefficiencies and verify on-the-ground conditions with greater accuracy than manual reporting allows.
For operators managing their own fleets comprised of both term and spot equipment, optimization involves more than just capacity. Optimal execution becomes about deploying the right type of equipment on the right routes. Factors such as barge size, tank configuration, draft limits, and port access all influence whether a particular asset is well-matched to the job. Right-sizing the fleet and reducing empty repositioning moves can lower costs (e.g., fuel), increase utilization, and improve service levels. Whether leveraging owned assets, chartered vessels, or a mix of both, logistics teams benefit from centralized visibility and data-driven tools to support dynamic fleet planning and reduce inefficiencies in the supply chain.
Building better fuel supply chain technology
Taken together, these technologies don’t replace the experience and judgment of logistics professionals but rather serve to augment it. Advanced analytics and dashboard tools provide a way to democratize access to insights. Creating visualizations tailored to the roles of terminal operators, dispatchers, schedulers, and commercial teams can ensure that decisions are based on consistent, reliable data. Role-specific dashboards powered by AI, ML, and automation improve collaboration across terminals, schedulers, and commercial teams. This not only improves individual task execution but also fosters stronger collaboration across functions. By streamlining how data is collected, shared, and acted upon, energy companies can transform barge logistics from a reactive bottleneck into a strategic advantage.