The tariff landscape in 2025 has been shaped by the overhaul of “Liberation Day,” where the United States imposed a flat 10% tariff on nearly all imported goods while raising duties on strategic sectors such as steel, aluminum, autos and auto parts under Section 232.
Some auto-related categories now face tariffs of 25%, and the use of the International Emergency Economic Powers Act broadened coverage even further with certain products carrying total tariff burdens above 40%.
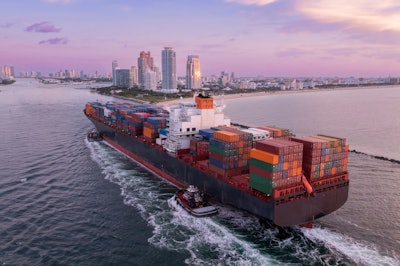
These changes triggered immediate supply chain disruptions, increasing costs and prompting companies to reassess sourcing strategies, pricing and inventory management.
As the year progressed, the market gradually absorbed these shocks. Blank sailings on key U.S. lanes fell 65% from their April peak as carriers returned to more predictable schedules and shippers adjusted to the tariff driven demand environment, according to data released by project44. U.S. imports from China and exports to China remained below prior years, though exports showed early signs of recovery with November posting the smallest year over year decline since January. Meanwhile, Thailand and Indonesia appear to be strengthening their roles as alternative sourcing hubs for U.S. importers.
Key takeaways:
· April 2025 marks the peak in blank sailings at a total of 131 blank sailings across 6 routes. The lanes with the most blank sailings that month were Asia to the United States at 39, China to the United States at 33, and the United States to China at 30. These three lanes have had the highest rates of blank sailings throughout the year.
· November 2025 saw a 65% decrease in blank sailings compared to the peak in April, with a total of 46 blank sailings across all 6 routes. This rate of blank sailings is considered normal, and it demonstrates that sailing schedules have normalized compared to the tumultuous months observed earlier in 2025.
· In November, China to the United States has the highest rate at 14 blank sailings, with the United States to Asia at 10 and the United States to China at 9. China to the United States is the exception, as it saw a 75% increase compared to 2024
· A closer look at U.S./China trade flows in 2025 reveals sharp swings tied directly to tariff actions and market anticipation.
· On the import side, shipments from China to the United States are trending 28% lower through November compared to 2024. After modest gains in January (+1%) and February (+4%), volumes fell steeply and have remained 42% lower in November compared to 2024 volumes. These swings illustrate how tariffs and front-loading behavior created early-year increases followed by sustained weakness through the summer and fall. Despite falling imports from China to the United States, China’s trade surplus has hit $1 trillion for the first time, showing that China has strengthened trade relations with other countries and is not dependent on the United States for their exports.
· In response to the U.S. tariffs, China passed their own tariffs on U.S. goods, impacting exports from the United States to China.
· On the export side, shipments from the United States to China are under even greater pressure, trending 41% lower year-to-date. Monthly volumes have been consistently negative against 2024, with drops exceeding 50% in April, May, August, and October. November shows the smallest decrease compared to 2024 since January, at just 23% lower than November 2024.
· The de minimis exemption allowed packages entering the United States with a value of less than $800 to be exempt from tariffs and duties. This led to an uptick in U.S. consumers being surprised by a tariff bill after a package was delivered and created a need for an average consumer to have a higher awareness for where online orders are shipping from and what tariffs and duties they might incur. This has also led to an increase in work needed for e-commerce shippers to process shipments from overseas.
· Despite the end of de minimis, last-mile on-time performance improved by 2% between August and October. November saw a 1% decline in on-time performance, but this is a result of peak season beginning rather than de minimis. This does not mean packages aren’t facing delays due to the extra paperwork and processing required for imports but rather reflects that many retailers fulfill e-commerce orders domestically. Major retailers often import in bulk, stock fulfillment centers, and ship domestically.