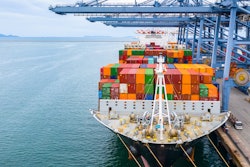
In July, U.S. container import volumes surged to 2,621,910 twenty-foot equivalent units (TEUs), up 18.2% over June, according to Descartes Systems Group’s August Global Shipping Report. Imports from China climbed to 923,075 TEUs in July, a 44.4% month-over-month increase and the highest level in 2025 since January.
For a second consecutive month, the top West Coast ports maintained the lead in market share over East and Gulf Coast ports. Overall, port transit time delays increased only modestly at top U.S. ports in July, indicating that infrastructure performed well despite elevated volumes. The August update of the logistics metrics monitored by Descartes suggests that, while global supply chains continue to grapple with ongoing geopolitical disruptions, trade policy developments are also creating sustained trade uncertainty.
“Following two months of uneven performance, July’s surge in container imports underscores the impact of U.S. tariff policies, not just seasonal demand cycles, on container volumes,” says Jackson Wood, director of industry strategy at Descartes. “Trade uncertainty remains high, however, as U.S. importers evaluate their supply chains in the face of the August 1 implementation of reciprocal duties on over 60 countries, the Aug. 7 start of India-specific tariffs and the universal copper tariff, and the Oct. 15 expiration of the U.S.–China tariff truce.”
Key takeaways:
· Reversing slower activity in May and June, July volumes surged to 2,621,910 TEUs, up 18.2% from June and 2.6% higher than July 2024. July volumes were just 555 TEUs shy of the all-time record set in May 2022. While consistent with the month-over-month peak season rise in ocean shipping that has occurred over the last nine years, July volumes also reflect suspected tariff-driven frontloading by U.S. importers ahead of impending trade policy shifts. Compared to pre-pandemic July 2019, volumes were up 19.3%. Total TEUs through July are up 3.6% compared to the same period in 2024.
· July U.S. container imports from the Top 10 countries of origin (CoO) jumped 25.4% month-over-month, led by significant increases from China and Hong Kong. After prior months of tariff-driven weakness, China posted an impressive gain of 283,775 TEUs, up 44.4% from June and off the record high of 1,022,913 TEUs set in July 2024 by 9.8%. China’s share of total U.S. imports rose to 35.2%, its highest since early 2025 but still trailing the record 41.5% share seen in February 2022. Hong Kong also posted a notable increase in July, rising 25,185 TEUs (47.8%). The widespread increases suggest a resurgence in Asia-origin shipments among U.S. importers.


