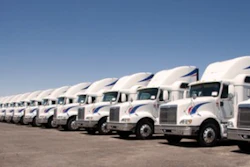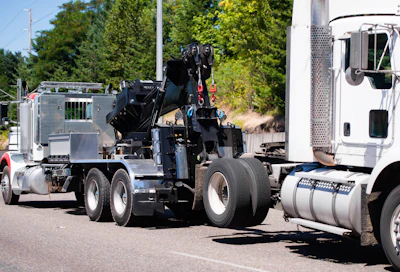
Most fleet managers treat towing and storage as a fixed line item. Something goes wrong, a vehicle gets towed, storage fees accumulate while the repair gets scheduled. The cost shows up in the monthly report and nobody asks the deeper question.
That question is about movement. Every tow is a vehicle that moved somewhere it should not have. Or stayed longer than it needed to. Or sat idle in a location with no retrieval plan. The fee is just the invoice. The real cost is the wasted movement behind it.
The idle vehicle problem nobody budgets for
Storage fees and towing bills spike at predictable moments. End of quarter, right after a route restructure, when a depot gets decommissioned. Fleet managers know this. But the spike gets absorbed as a one-time event rather than treated as a signal about how the fleet moves between jobs.
A vehicle sitting in a third-party storage lot is a vehicle that was dispatched poorly, routed badly, or left somewhere with no retrieval plan. The storage cost is real. But it is a symptom.
The U.S. Department of Energy has tracked idle time as one of the largest contributors to unnecessary fuel consumption across commercial fleets. Close to one gallon per hour for a heavy vehicle sitting with the engine running. Storage is the static version of that same problem. A vehicle burning money by going nowhere.
Towing costs run separately. The American Transportation Research Institute has documented operational costs across trucking fleets for years, and vehicle recovery consistently appears in the miscellaneous cost categories that operators struggle to predict or control.
Cost and emissions are the same decision
This is where things get interesting. Fleet managers who have started tracking towing and storage events against route data are finding something consistent.
The vehicles with the highest storage fees are almost always the same ones with the most unplanned movement. Extra trips to retrieve a vehicle from a wrong location, repositioning runs that serve no delivery purpose, deadhead miles to cover for a unit that ended up off the route network.
Every one of those movements burns fuel. Every repositioning trip adds emissions with no freight attached to offset it. The environmental footprint of a fleet is not just about what gets delivered. It is also about what moves for no reason.
Supply chain operators have spent considerable effort on route optimization for loaded vehicles. Fleet sustainability research shows that empty miles and idle time consistently account for a larger share of fleet emissions than most operators initially estimate. Towing and storage are part of that same story.
Smarter storage management starts before the tow
The fleets that have cut storage costs most aggressively did not do it by negotiating better rates with storage providers. They did it by changing where vehicles go between jobs.
This sounds obvious. It is not always easy. Dispatchers under pressure to close out a job send vehicles to wherever is convenient in that moment. The retrieval cost comes later, from someone else's budget, in a different reporting period. So the incentive to plan for it is weak.
Some operators have started treating storage fees as a dispatch performance metric rather than a facilities cost. That shift changes who is accountable and when they see the number.
Towing frequency tells you something too. A fleet running 3-5 unplanned tows per month across a 50-vehicle operation has a different set of problems than one running 15 or more. The first might be random mechanical failure. The second is almost always a routing or positioning problem in disguise.
The environmental footprint hides in recovery costs
Fleet sustainability reporting has matured. Most operators now track fuel economy, loaded miles, and emissions per delivery. Some track idle time.
Very few track the emissions from recovery movement. Not the tow truck itself, not the repositioning driver sent to retrieve a stranded unit, not the extra dispatch cycle needed to cover the gap. Those miles are real. They just do not show up cleanly in standard fleet emissions calculations.
When operators start including recovery movement in their emissions accounting, the numbers shift. Not dramatically in most cases. But enough to change the priority ranking of where to reduce.
A 50-vehicle fleet running 12 unplanned recovery events per month, each requiring 40 miles of repositioning, generates roughly 6,000 miles of non-revenue movement annually from that one category. At average commercial fleet fuel consumption, that is somewhere between 1,200-1,500 gallons of fuel. Not nothing.
What the data usually shows
Fleet managers who have audited towing and storage spend against route records tend to find the same pattern. A small number of routes or depot locations account for a disproportionate share of events.
The 80/20 rule applies here as reliably as it does most places. Roughly 20% of the route network generates around eighty percent of the towing and storage costs. That concentration makes the problem more solvable than the aggregate number suggests.
Fixing the Top 3-4 problem locations usually moves the needle more than a broad operational overhaul. It also makes the emissions case easier to argue internally. The reduction is concentrated and measurable.
The cost efficiency argument and the sustainability argument are pointing at the same fix. That is not always true in fleet management. When it is, it tends to be worth paying attention to.