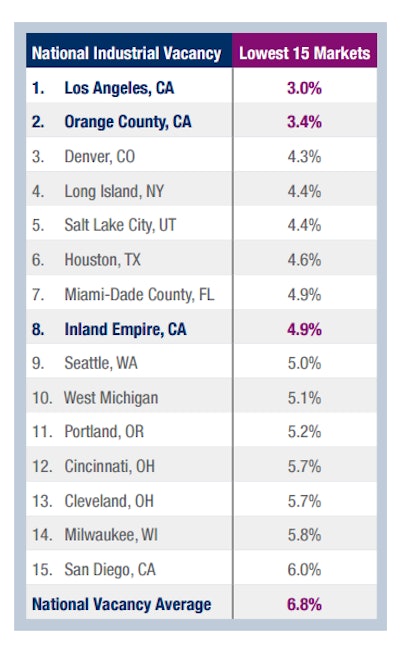
Cushman & Wakefield announced that U.S. industrial markets absorbed a record-setting 70.1 million square feet (MSF) of space in the second quarter of 2016, up 6.0 percent from the same period a year ago, and propelled year-to-date absorption to 132.2 MSF. Strikingly, 38 U.S. markets saw over 1 MSF of absorption during the second quarter with 11 markets witnessing over 2 MSF of quarterly net occupancy growth. This marked 25 consecutive quarters of net occupancy gains for the industrial sector with the current quarter’s absorption reaching a new cyclical high. The national industrial vacancy rate continued to decline in the second quarter, falling by 30 basis points (BPs) from the prior quarter and 80 BPs from the prior year to 5.8 percent. Industrial vacancy is currently tracking at the lowest level of the past 30 years and is a full 270 BPs below the 10-year historical average.
Kevin Thorpe, Cushman & Wakefield’s chief economist, says that, despite a series of shocks to the U.S. economy this year and heightened uncertainty emanating from Europe, economic fundamentals remain mostly solid.
“We expect to see some headwinds form in manufacturing and exporting created by the stronger U.S. dollar, but other important industrial-related indicators, such as containerized traffic flows, transportation indices and business inventories, demonstrate that the industrial market remains on a robust path,” Thorpe said. “In fact, the recent European-driven volatility will likely create renewed tailwinds for the U.S. property markets in the form of lower gas prices, stronger foreign capital investments and a more real estate-friendly fed policy than most expected entering into this year.”
Strong tenant activity and supply constraints continue to fuel rent growth. U.S. industrial rents increased 4.1 percent in the second quarter compared to a year ago. Industrial rents increased in 68 of 79 markets tracked by Cushman & Wakefield from the second quarter of 2015 to the second quarter of 2016 with over a quarter of the country now reporting double-digit gains. In many markets, industrial rents are now at historic highs, and on a national level, the U.S. is witnessing rental rate appreciation for every industrial product type.
John Morris, executive managing director of logistics and industrial services for the Americas, also expects continued growth for the industrial sector.
“The roll continues for the Industrial real estate market,” Morris said. “While we are starting to hear speculation that the market somehow feels toppy, or mature, there remains no evidence that the positive cycle for industrial is nearing its end. The warehouse market continues to exceed expectations, seemingly unfazed by what is happening globally.
“Will the market slow? At some point, of course, but we do not see that on the current horizon. We remain incredibly busy and significantly optimistic,” Morris concluded.
On the development front, 99.9 MSF of industrial product was delivered in 2016 with 46.9 MSF of it coming online in the second quarter. Major industrial markets, port cities and primary inland distribution hubs are welcoming the majority of industrial deliveries this year—industrial product that is increasingly speculative in nature. Speculative projects accounted for 71.5 MSF (or 72 percent) of year-to-date deliveries, and developers continue to break ground on more speculative developments as vacancy rates in many markets remain at or near historical lows.
Jason Tolliver, head of industrial research for the Americas, notes that both new development and leasing activity remain concentrated around major population centers and that—although leasing fundamentals are strong—a robust speculative pipeline may soften spots of the market in the future.
“Even though development volumes are increasing, quarterly leasing demand continues to outpace supply,” Tolliver said. “But developers are hustling to capitalize on these hefty absorption figures. With 190 MSF in the development pipeline, we will see some softening in markets where speculative construction is the heaviest in 2017. Frankly, the market needs the space to bring supply/demand fundamentals closer to balance.”
In the second quarter of 2016, the top 10 strongest markets in terms of demand for industrial space were the Inland Empire, with 8.2 MSF of absorption; Chicago, with 7.3 MSF; Dallas/Fort Worth, with 4.5 MSF; Atlanta, with 3.6 MSF; Greenville, South Carolina with 3.6 MSF; the Pennsylvania I-81/I-78 Distribution Corridor, with 3.6 MSF; Indianapolis, with 2.7 MSF; Phoenix, with 2.2 MSF; central New Jersey, with 2.2 MSF; and the East Bay, with 2.2 MSF.
Among the tightest markets in terms of overall vacancy included Los Angeles, at 1.6 percent; Orange County, California at 2.3 percent; San Jose, California at 2.4 percent; Savannah, Georgia at 2.4 percent; East Bay, at 2.8 percent; Denver, at 3.4 percent; Nashville, at 3.9 percent; Cincinnati, at 4.0 percent; Milwaukee, at 4.3 percent; and central New Jersey, at 4.3 percent.


![Pros To Know 2026 [color]](https://img.sdcexec.com/mindful/acbm/workspaces/default/uploads/2025/08/prostoknow-2026-color.mduFvhpgMk.png?ar=16%3A9&auto=format%2Ccompress&bg=fff&dpr=2&fill-color=fff&fit=fill&h=135&q=70&w=240)


