A Fortune 1000 global engineering and construction company servicing the oil and gas industry leveraged Chicago-based Spend Radar to load, aggregate, map and cleanse direct materials data; and to provide accurate reporting and analysis on their global supplier key performance indicators (KPIs). These KPIs included:
- Spend
- Savings
- On-time delivery
- Quality
- Internal forecast and demand
Their existing spend analysis solution had been developed in-house and the process to maintain, extract and view the data was time consuming. Every month, the direct materials data was pulled out of their SAP systems, and then circulated throughout five different groups within the procurement department—each of which manually manipulated the data. The output of this process was a series of Excel spreadsheets (pivot tables and static charts) which was neither user-friendly nor “drillable.” With the amount of time required to generate the KPI reports, the company did not have timely access or visibility into supplier performance issues and couldn’t make strategic business decisions based on that data.
By nature of its business, missed customer project deadlines result in millions of dollars of lost revenues or incremental customer fees. Consistently, there was dispute as to the source of missed project deadlines. The Fortune 1000 company’s sourcing and supply chain team felt deadlines were missed due to their supplier’s inability to deliver according to the KPIs and Service Level Agreements (SLAs) to which they had committed. To the contrary, their suppliers complained that the sourcing and supply chain organization was not forecasting accurately, resulting in inadequate lead times to meet the KPIs and SLAs.
Project details
In order to aggregate and harmonize all cross-functional product and performance data for the company within a 20-business-day time frame, Spend Radar’s solutions consultants were able to effectively manage the client's data through implementation of its Data Manager solution. While all spend analysis initiatives involve varying levels of data accuracy, throughout the project Spend Radar was able to identify numerous issues with the Fortune 1000 company’s data that they weren’t aware of. A unique aspect of this project was incorporating customer-specific KPI metrics and algorithms.
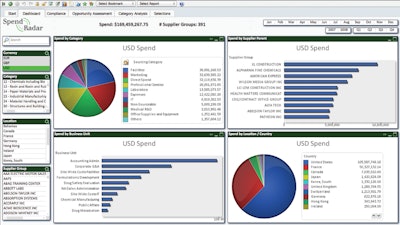
This incorporated the company’s KPIs using custom algorithms that were added to Spend Radar’s Data Manager. Working with purchasing and IT, Spend Radar pulled data from over 130 global locations in five different SAP file formats. Upon completion, end users were provided training on the reporting and analysis module, which provided a user-friendly dashboard to view enterprise-wide KPIs.
“Spend Radar was able to leverage our next-generation platform to aggregate and normalize the multiple disparate global forecasting systems, unique SLAs and disparately-measured global KPI environments and criteria to provide one unified ‘source of the truth,’ enabling our customer to identify and resolve the source of their enterprise problem,” said a representative of the Fortune 100 company.
As a result of the implementation, the client now accesses Spend Radar’s Data Manager directly and will continue to incorporate additional spend and performance-related data. In addition, Spend Radar prepared a tailored analysis environment providing the company with global spend, supplier performance and enhanced forecasting visibility. Ongoing compliance monitoring is achieved through monthly data refreshes. Since project completion, the client added two more key performance indicators—open orders and supplier financial analysis.
Business benefits
The ongoing benefits derived from this project include:
- Aggregation and normalization of disparate global KPI environments and SLAs into a single repository that includes forecast data and spend data (the latter to understand which suppliers had the greatest impact to their business)
- Ability to indisputably identify internal and/or external performance issues and take corrective action, which directly affects their ability to deliver to their customers and achieve customer satisfaction.
- User-friendly dashboard used across the global organization which requires little to no training to use compared to the series of Excel spreadsheets (pivot table and static charts) that were used prior implementation
- Enhanced strategic role of procurement within the global organization, providing timely information to base strategic decisions on
- Timely visibility into regularly updated spend data compared to the amount of time it took to generate KPI reports using multiple Excel files
The result
Upon completion of the project, the customer licensed Spend Radar’s Reporting and Analysis tool to enable their sourcing, performance management and supply chain team to have access to the insights and information needed to improve performance—both internally and from their suppliers.
A critical component of a spend analysis program is the performance management aspect, the missing piece from just about every vendor in the market. It is nearly impossible to deliver real results if you cannot measure the performance of all sourcing and savings programs in a timely fashion. After all, the goal is to not only deliver bottom-line impact but also quickly identify underperforming suppliers before they have a negative impact on your business.
Spend Radar’s Complete Spend Analysis Glossary contains over 100 spend analysis terms and provides definitions that are tailored specifically to spend analysis. View it online at http://www.spendradar.com/spend-analysis-glossary/.