Managing the performance of your suppliers, a critical component of overall supply and demand chain management, can have a material impact on your company's revenue growth and operating margin. Not investing in how you manage supplier performance, especially in a down economy, can have a negative impact on your profits, assets and cash flow. This article lays out a framework — a "management operating system" — for the discipline of closed-loop supplier performance management (SPM) and shows the hard-dollar return on investment that this discipline can deliver.
A Framework for Next-generation SPM
We developed this framework based on our work with overall enterprise performance management and have found that it works well when focusing on supplier performance or any dimension of the supply chain. The goal of the framework is to help manage the process of strategy to execution. You already have overall company strategic objectives: a certain level of revenue growth at a particular target margin, or an expected level of market-share and brand recognition, for instance. Within those corporate objectives, you have specific supplier performance objectives: a certain level of material quality, cycle times, inventory levels and so on. The challenge is to ensure that you efficiently — and sustainably — execute on those objectives and continuously improve your fact-based decision-making capabilities that get you closer to realizing your strategy.
To do this, you must be able to rigorously answer these questions: "What do we want to happen with suppliers, and how do we want it to happen?" and "What actually happened, and why did it happen?"
The framework says that you take your strategic supplier objectives and you debate them: Are we able to achieve those objectives? Do we have sufficient capital, people, customers and markets? What if we negotiated different terms with suppliers? What if we acquired some of our suppliers? What if we outsource more logistics services? What if fuel costs become even more unpredictable? Should we buy or build a certain component? This is where you build financial and operational models to record constraints and vet your assumptions about suppliers. Instead of a few spreadsheets run by a few analysts, this is an open process by the executive management team from all business functions — sales, marketing, procurement, and customer and supplier operations — with multiple scenarios recorded in a multidimensional system. It includes historical performance data as well as internal and external benchmarks to address questions such as "How do we do better than last time?" and "How do we do better than industry averages?" Once the most likely scenario is agreed upon (after a healthy and rigorous debate), this model forms the basis of your suppler plans.
Those plans form the basis for how you decide how and when you are going to deliver products and services to customers and consume materials and resources from suppliers. It's the commitment your managers, sales reps and developers make to execute on the plan (which was based on the models that were based on the strategy). It includes financial plans such as revenue forecast (by product and/or by geography and/or by day/week/month), expense and cost-of-goods-sold budgets, cash-flow forecast, and other plans. It also includes operational plans such as your production plan, materials purchasing plan, workforce plan and even your capital expenditure plan.
Having a systematic debate that informs your decision helps prevent the institutional amnesia that occurs when results aren't delivered as expected and senior management asks why the bar was set too high or too low. When plans are consolidated from each function and each business unit around the company, more constraints and assumptions are uncovered — and those should be fed back into the models so that the next model (next week, next month, next quarter) is even better than before.
While you are busy buying materials and services from suppliers, making products and services, and delivering to customers, you continually gather information about the business. This includes financial and operational reporting such as management reporting, product quality reporting, vendor-managed inventory reports, third-party logistics (3PL) reports, customer satisfaction reporting and so on. This involves taking the raw transactional data (purchase orders, invoices, bills of lading) and turning them into useful, actionable information.
Once we've gathered believable information (by "believable," we refer to high data quality and common definitions and rules), we want to understand why we got the results we got. If we are spending more with one supplier than expected, what was the cause? Could it be we needed more raw materials or more finished-goods storage than we expected, and if so, what was the cause? Did we do a poor job of forecasting demand? Did we have a pricing promotion that production didn't know about? We want to get to the root cause of variances and problems — also known as "surprises" — and take action to fix them now and prevent them from happening in the future.
Most businesses are doing some form of each of these processes today. And they generally do them in silos: manufacturing has its direct relationships with suppliers, while procurement is brought in to work on contracts; HR isn't often brought in for manufacturing staffing issues until the need is "right now" or until contract labor overtime is too burdensome; and sometimes different parts of the business use the same vendors under different contracts without leveraging them for better prices and terms. By using different technologies, unshared data and business rules, with low or no sharing and collaboration across all four areas of the framework — not to mention low or no alignment with strategy — companies get low visibility into supplier performance, low believability in the numbers, and low accountability for results and corresponding actions. Supplier performance management is about bringing together all of the debate, decide, gather, and understand processes, technology and people into a unified system.
Why Does Unified SPM Matter?
The best way to illustrate the business benefit of a unified supplier performance management system is to show the potential financial impact on a company. We'll present a case study using the computer hardware industry.
We picked Lenovo Group as our target company. Lenovo is the largest IT enterprise in China and acquired IBM's Personal Computing Division in 2005. The company manufactures and distributes brands such as ThinkPad and has manufacturing, distribution and support clusters in Raleigh, N.C., Beijing, Mexico, Brazil, Scotland, Hungary, India, Japan, Australia and Singapore. We benchmarked Lenovo to the following competitors:
- Apple, Inc.
- Dell, and
- Gateway
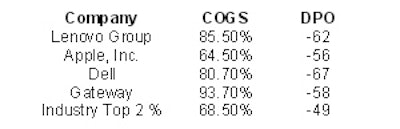
Using only publicly available GAAP data for the last four quarters for each company, we looked at a variety of results and focused in on two: cost of goods sold (COGS) as a percentage of revenue, and days payable outstanding (DPO). (See Figure 1.)
For cost of goods sold as a percentage of revenue, where a lower percentage means they spend less on raw materials and on the design, manufacture and distribution of products, Lenovo Group ranks fourth out of five. For days payable outstanding , an indicator of how long a company is taking to pay its vendors and other trade creditors, they were second out of five (longer is generally — but not always — better for DPO, since the company can earn on the cash it owes trade creditors).
With only a 2 percent improvement in COGS and a 2 percent improvement in DPO, these incremental improvements would produce $167.7 million in cash as well as $239.7 million in recurring benefits for Lenovo. And we know 2 percent is possible in their industry since the competition is achieving results beyond 2 percent. So how can supplier performance management impact COGS and DPO by 2 percent?
To start, one of Lenovo's "five pillars" of strategy is to "pursue operational excellence," which is about streamlining and improving their global supply chain and logistics network. Some of the initiatives already undertaken to improve the supply chain include:
- Operating its own facilities closer to their customer base in key geographies;
- Expanding the reach and impact of its Lean Six Sigma application within the global supply chain; and,
- Continuing to improve its logistics network
Some of the potential initiatives around supplier performance management, using our framework described above, that can have a direct impact on the cost of goods sold and/or days payable outstanding, include those mentioned in Figure 2.
Any combination of those initiatives could potentially improve COGS and DPO by at least 2 percent by giving Lenovo better visibility, believability and accountability into supplier performance. And an investment in improving those processes and technologies is worth $167.7 million in cash, not to mention the recurring financial benefit.
How Do You Get Started?
If you can see the benefit of bringing together the four strategy-to-execution processes (debate, decide, gather and understand) specifically for supplier performance management, and your calculations tell you that there can be a positive ROI, then how do you get started with this new discipline?
1. Enroll the business: Show this framework to your team, to IT and to your senior management. Help them see a vision for the discipline around managing supplier performance and executing on supplier strategy. We have found that drawing it live on a whiteboard, giving examples along the way and highlighting connections that don't currently exist makes a big difference (bigger than showing the framework as a PowerPoint slide, for example).
2. Find your specific drivers of value that materially affect suppler objectives (like we did for Lenovo with COGS and DPO).
3. Map the value chain of those drivers of value right across the organization and down through the layers so your executive management team can see the impact that suppliers have in areas other than production and procurement. This becomes your supplier value map. Also show them how those drivers relate to overall company strategic objectives.
4. Work with your IT team and inventory the current systems (process and technologies) in each area of the framework. Also, understand IT's current roadmap for systems that relate to the value drivers mapped in No. 3 above.
5. Map the current systems and roadmap systems to the value drivers and focus on the gaps: What are you not measuring, monitoring, analyzing or planning for that drives supplier performance? Also, cut out the noise: Prioritize those outputs (reports, analyses, etc.) that have the greatest impact on the business.
6. Realign the IT roadmap and current systems with those areas that have the most material impact on the value drivers that affect supplier performance. Then begin the project of updating the current initiative or implementing the new initiative.
7. Periodically review the systems and processes with the value map you created earlier to see if you are on track or if course corrections are required.
The enrollment and discovery steps above are necessary to align processes and IT initiatives with supplier strategy and corporate strategy. While going through these steps, companies have found additional side benefits that they weren't expecting. For example:
- One client in the energy sector uncovered 13 technology-related initiatives being undertaken by different business units and departments that the chief information officer (CIO) and his team did not know anything about — each one was duplicating the effort of getting at the data, using a variety of front-end tools, and did not include controls or data governance in their projects. The CIO, with the CEO's support, then used the value map as their "North Star" for the entire IT portfolio.
- An insurance provider's chief financial officer discovered a plethora of metrics that were being reported monthly for no other reason than "it was easy to get at the data."
- When finished with the exercise, one healthcare CEO declared that the value map (the entire business on one sheet of paper) would be his "accountability" map to make sure all layers of the business were working on executing strategy.
Hopefully, you can use this new framework to bring discipline to your supplier performance management And you will certainly get benefits (known and unknown) from the seven steps above. And who knows, maybe you'll be able to find $167.7 million dollars for your efforts.