Transcepta released new data that highlight an overall, but uneven, increase in economic activity throughout the United States continuing through the third quarter. The data, collected from the company’s cloud-based Procure-to-Pay (P2P) platform, may provide insight into the 2020 Presidential election, as well as additional factors for pollsters and commentators to consider when predicting the outcomes of races.
Pollsters often point to the well-known statistic that since 1928, the incumbent party has won nearly 90 percent of presidential elections during a stock market upswing. However, 2020 is a year like no other which makes predictions much more complicated than in previous election cycles. Although the Transcepta Economic Activity Indices show an overall upswing in business activity, with invoice volume, invoice spend amounts, and early payment discount offers and acceptances tracking up, the data varies by industry.
“This may present an interesting scenario and some additional factors for pollsters to consider when making predictions for the 2020 Presidential election,” said Transcepta President and CEO Ray Parsons. “Overall numbers are tracking towards a recovery and showing business activity inching closer to pre-COVID levels, which may benefit the incumbent. However, given the fact that the recovery is uneven across industries, that may benefit the challenger. This data is definitely something worth digging into when considering different scenarios.”
The Transcepta platform represents tens of millions of transactions across every industry. By tracking invoice volume, combined with other economic indicators such as how long it takes for companies to make payments and the dollar value of corporate spend, Transcepta can see and track trends that provide insight into the strength of the economy.
The company has expanded its economic tracking to include more variables, which are purposely limited to US-based companies, but also include the entire Transcepta Supplier Network’s global footprint. The datasets are compiled using machine-learning algorithms that crunch large amounts of supplier data and regression analysis, highlighting economic patterns that shine a light on important trends in the market.
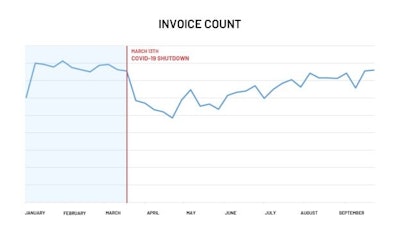
Examples of the economic recovery are represented in two graphs. Despite fluctuations, the first index (reflected in the “Invoice Count” graph) shows that aggregate invoice volume has continued to steadily increase over the duration of the third quarter. The trajectory as a whole shows an upward trend since the COVID-19 pandemic initially shut down the economy, with invoice volume back up to pre-pandemic levels.

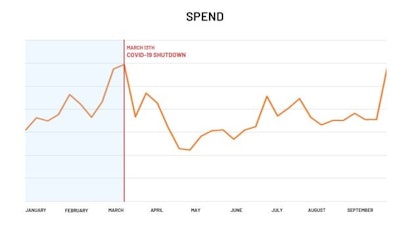
Similar to the invoice volume tracking, aggregate spend amounts (as shown in the “Spend” graph) also show an overall upward trajectory, demonstrating that businesses as a whole are spending more—about as much as they spent pre-COVID.

In addition to invoice volume and spend amounts, Transcepta’s data tracks how long businesses are taking to pay their suppliers. “When the pandemic-induced economic shut down initially occurred, suppliers experienced a cash crunch,” Parsons added. “In order to help improve cash flow, some suppliers increased the number of early pay discount offers to their customers. What we’ve seen is that when these types of offers were made, there was a large spike in early payments. This signifies some customers are in a strong cash position and are willing to trade cash flow for higher profit margins.”
Given that Transcepta has clients in virtually every industry, it’s able to break the data down even further, providing economic tracking by vertical market.


