How long is your product tail? If you are not directly involved in measuring it, the answer may surprise you. According to Terra Technology’s 2015 Forecasting Benchmark Study, the average tail in consumer goods contains 81 percent of all items and continues to get longer each year. These are your slowest moving items that make up 20 percent of total sales volume. To put things in perspective, only 1 percent of items are top sellers. While long tails are good for digital businesses with minimal inventory costs like iTunes or Spotify, they represent a major financial commitment and disproportional cost burden for make-to-stock manufacturers. Too often, these items provide negative returns, undermining the margins of the entire portfolio. However, controlling the costs of the tail is becoming much easier.
Innovation Fuels the Tail
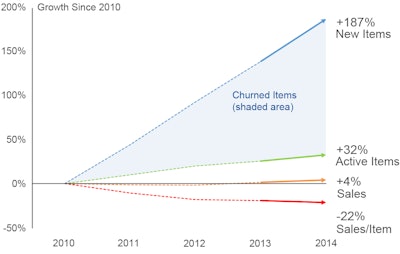
Over the past five years, the number of active items in consumer goods grew by 32 percent, with growth through innovation strategies driving complexity instead of sales. More alarming is the rate of product introductions and churn, with the number of total items offered nearly tripling in five years—most of which were discontinued. While everyone likes to think their next new launch is a winner, the reality is that 95 percent of new introductions end up in the tail and only one in a thousand start off as a top seller. This is pretty disheartening considering the importance placed on innovation.
What’s more, items that start off in the tail tend to stay there. Only 4 percent manage to escape to become more successful and none turn into top sellers—it is almost like the tail is supply chain’s equivalent of a black hole. This underscores the importance of quickly culling introductions that fail to meet expectations.
A different view of the data shows that the top 10 percent of items generate 75 percent of sales, whereas the slowest moving 50 percent account for only 1 percent of volume. In other words, companies could cut their complexity in half with little or no impact on sales. It’s likely that when A.G. Lafley returned to Procter & Gamble, a similar exercise led to the decision to shed low-volume brands as a way to raise shareholder value.
Hidden Costs in Plain Sight
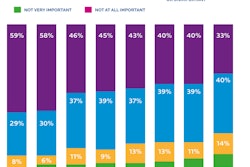
Long tails are hard to manage because there are simply too many items to deal with. Planners naturally focus their limited resources on the important and politically sensitive top-selling items. Not surprisingly, forecast value-added for items in the tail is one sixth what it is for top sellers, at 3 and 19 percent, respectively. In terms of capital, lower forecast accuracy for products in the tail means that companies need to carry higher investments in both safety and cycle stock. The disproportional shift in inventory toward slower moving items is significant, with 50 percent of the total stock investment covering only 20 percent of the volume.
Just as error is higher for items in the tail, so is bias, which is six times greater than for top sellers. Without the sufficient time to care for slow-moving items, the natural inclination is to over-forecast, thereby protecting customer service and revenue. While this seems like a quick and easy, it is very costly in terms of unproductive inventory. The situation is even worse for new introductions in which high forecasts are routine. On average, new products in the tail are over-forecasted by 25 percent. This drives a lot of excess stock, especially considering that 95 percent of introductions end up in the tail.
The costs of the long tail go far beyond the obvious slow-moving and obsolete inventory, and materials write-offs. A finance executive looking at the capital costs would find that the bottom 50 percent of items require 23 times as much inventory per dollar of revenue than the top 10 percent. By looking at net profits, one would find that poor forecast accuracy led to lost revenue from stock-outs, and higher operating costs from transshipments and expedites, both which erode margins. Meanwhile, a board member scrutinizing the financials would see higher working capital requirements and lower operating profits eating into shareholder value. Regardless of your perspective, the long tail represents a huge cost that companies are failing to recognize and address.
Taming the Tail
The tail actually impacts every aspect of your supply chain—from manufacturing efficiency to planner productivity, service levels and warehouse sizes. Managing it helps companies improve profitability, cut excess inventory, drive growth, lower costs and increase cash flow.
There is a lot of opportunity to tame the tail. Companies can make costs visible by including a review of financial performance by item as part of sales and operations planning (S&OP). While it is not possible to review every single item in the S&OP process, there are ways to gain visibility to problems and proactively deal with them. We are starting to see customers incorporating financial metrics by stock-keeping unit (SKU) within S&OP discussions to identify products that destroy value, and present hard facts to sales and marketing. Belief that every item in the tail is strategic and cannot be dropped without losing a customer is incorrect. It is simply not possible that 50 percent of all items are very low volume, but also strategic.
Also, smarter software to sense demand and optimize inventory augments planners’ capabilities, freeing their time up to focus on other things. Predicting the tail is a complex problem that requires a complex solution. The days of simply over-forecasting or applying rules of thumb through segmentation are being eclipsed by new automated algorithms capable of modeling every item at every location. No worries about workload—there are never too many SKUs for automated algorithms. Not surprisingly, applying the same care to items in the tail as to top sellers makes a big difference in performance, and gives management the step-change in productivity they are after, with error dropping 37 percent and forecast value-added jumping four times, from 5 percent to 20 percent.
This is good news for companies tired of having their supply chain wagged by the tail.